

Question
What is the slope of a line which is parallel to y-axis?
- -1
- 0
- 1
- Not defined
The correct answer is: Not defined
If a line is parallel to y-axis then angle formed by it with x-axis is zero. So, its inclination is 90°. Hence slope = tan 90° which is not defined.
Correct option is (c).
The slope of line parallel to y axis is undefined or not defined .
The line will be vertical.
Related Questions to study
What is the slope of a line which is parallel to x-axis?
Correct option is (b).
The slope of line parallel to x axis will be 1
The line be horizontal
What is the slope of a line which is parallel to x-axis?
Correct option is (b).
The slope of line parallel to x axis will be 1
The line be horizontal
If slope of a line is 4 and x-intercept made by the line is 2 then the equation of line will be __________
 Given
Given
Slope(m)=4 and x intercept is 2
The general equation of slope intercept form is y=mx+c
At x intercept y=0
0=mx+c
0=4*2 +c
c=-8Therefor the equation will be y=4x-8
If slope of a line is 4 and x-intercept made by the line is 2 then the equation of line will be __________
Given
Slope(m)=4 and x intercept is 2
The general equation of slope intercept form is y=mx+c
At x intercept y=0
0=mx+c
0=4*2 +c
c=-8Therefor the equation will be y=4x-8
The slope-intercept form of the linear equation is
Correct option is (a).
The slope-intercept form of the linear equation is 
The slope-intercept form of the linear equation is
Correct option is (a).
The slope-intercept form of the linear equation is

The line that passes through the middle of the plotted points is known as
Correct option is (c).
The line that passes through the middle of the plotted points called Trend line
The line that passes through the middle of the plotted points is known as
Correct option is (c).
The line that passes through the middle of the plotted points called Trend line
A survey was made among students in a district and the scatter plot shows the level of reading and height for 16 students in the district. Describe the association and give a possible reason for it.

Correct option is (d)
When the level of reading is 2, heights of student is 50 inches
When the level of reading is 5, heights of student is 55 inches
When the level of reading is 7, heights of student is 60inches
When the level of reading is 6, heights of student is 45,55,60 inches respectively.
The graph shows when level of reading increases heights of students also increase , which means the garph is positive but for same level of reading there are more than one students of different heights which the association is non linear
A survey was made among students in a district and the scatter plot shows the level of reading and height for 16 students in the district. Describe the association and give a possible reason for it.
Correct option is (d)
When the level of reading is 2, heights of student is 50 inches
When the level of reading is 5, heights of student is 55 inches
When the level of reading is 7, heights of student is 60inches
When the level of reading is 6, heights of student is 45,55,60 inches respectively.
The graph shows when level of reading increases heights of students also increase , which means the garph is positive but for same level of reading there are more than one students of different heights which the association is non linear
David asked 20 people if they can buy a new product that he developed at each of several prices. The scatter plot shows how many of the 20 people said “yes” at a given price. Describe the association between price and the number of buyers.

Correct option is (a)
When David kept the price of his product $2 there were total 20 buyers
when he increased the price to $4 the number of buyers reduced to 19
when he further increase the price to $8 the number of buyers reduced to 11
The graph is clearly depicting when the dependent variable increases the independent decreases and the change in the dependent is not constant with the change iof independent variable
and hence it shows a case of non linear association
David asked 20 people if they can buy a new product that he developed at each of several prices. The scatter plot shows how many of the 20 people said “yes” at a given price. Describe the association between price and the number of buyers.
Correct option is (a)
When David kept the price of his product $2 there were total 20 buyers
when he increased the price to $4 the number of buyers reduced to 19
when he further increase the price to $8 the number of buyers reduced to 11
The graph is clearly depicting when the dependent variable increases the independent decreases and the change in the dependent is not constant with the change iof independent variable
and hence it shows a case of non linear association

Alexa is training for a 10K race. For each of her training runs, she recorded the distance she ran and the time she ran. She made a scatter plot of her data and drew a trend line. Use the trend line to predict how long it would take Alexa to run 4.5 miles.

For 1 mile alexa took 7.5 minute
for 2 miles she took 15 minutes
Similarily the trend of graph is clearly depicting the time taken for alexa to cover a distance of 4.5 mile is 45 minutes .
Alexa is training for a 10K race. For each of her training runs, she recorded the distance she ran and the time she ran. She made a scatter plot of her data and drew a trend line. Use the trend line to predict how long it would take Alexa to run 4.5 miles.
For 1 mile alexa took 7.5 minute
for 2 miles she took 15 minutes
Similarily the trend of graph is clearly depicting the time taken for alexa to cover a distance of 4.5 mile is 45 minutes .
The slope is undefined means
Correct option is (a)
When there is increase in dependent variable without any change in independent variable the graph shows a vertical line which means the slope of the line is undefined 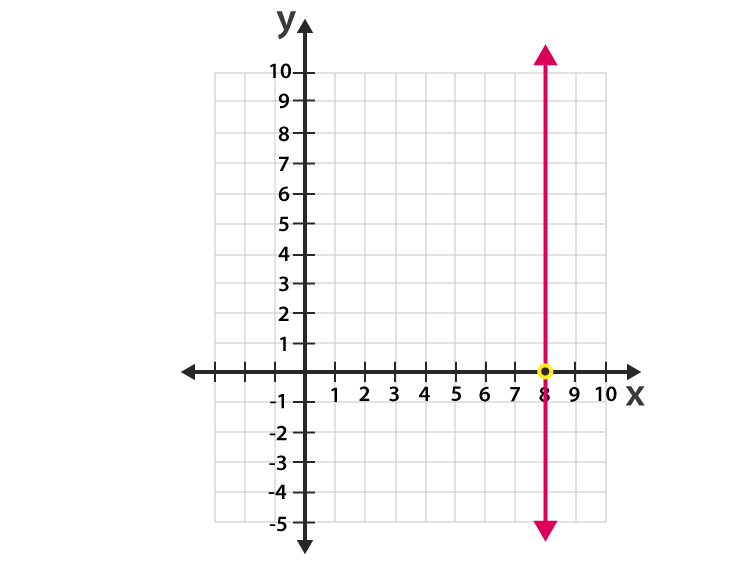
The slope is undefined means
Correct option is (a)
When there is increase in dependent variable without any change in independent variable the graph shows a vertical line which means the slope of the line is undefined
The slope is zero means
Correct option is (a).
when slop of any equation is zero it means there is no change in dependent variable with change in independent variable hence the graph becomes a horizontal line
The slope is zero means
Correct option is (a).
when slop of any equation is zero it means there is no change in dependent variable with change in independent variable hence the graph becomes a horizontal line

Which association has slope -1?
Which association has slope -1?
Which association has slope 1?
Which association has slope 1?
Which figure gives perfect linear correlation?
Which figure gives perfect linear correlation?
When the value of the independent variable increases and the value of the dependent variable
Increases such type of correlation is
When the value of the independent variable increases and the value of the dependent variable
Increases such type of correlation is
When the value of the independent variable increases and the value of the dependent variable
decreases such type of correlation is
The correct option is (a).
Reason : Whenever there is decrease in dependent variable with increase in independent the graph is downward with negative slope
When the value of the independent variable increases and the value of the dependent variable
decreases such type of correlation is
The correct option is (a).
Reason : Whenever there is decrease in dependent variable with increase in independent the graph is downward with negative slope
The scatter plot shows David’s height at various ages. Choose the right answer that describe the type of association between David’s age and his height.

The corerect option is (c)
Reason :
As the height of David increases with increase in his age , the graph is going upward as both the variable are increasing so it is a case of positive association and since there is almost constant change in both the variable it is shows linear relationship also
The scatter plot shows David’s height at various ages. Choose the right answer that describe the type of association between David’s age and his height.
The corerect option is (c)
Reason :
As the height of David increases with increase in his age , the graph is going upward as both the variable are increasing so it is a case of positive association and since there is almost constant change in both the variable it is shows linear relationship also


